Use the inventory turnover calculator ↓
The inventory turnover ratio is cost of goods sold divided by average inventory for the same period. It expresses how many times the business sold the equivalent of its average inventory balance, measured at cost.
If annual cost of goods sold is $600,000 and average inventory is $100,000, turnover is 6 times per year. That number is a useful starting point. It does not tell you whether every SKU sells well, whether customers encountered stockouts, or whether the business made an acceptable margin.
Treat a change in the ratio as a reason to inspect the underlying stock and sales records. Before acting on it, check the cost basis, the period, and how the inventory average was calculated.
How fast is your inventory turning?
Calculate your inventory turnover ratio and inventory days for the period you choose.
Illustrative example · 365-day period
during this 365-day period
Behind the numbers
A higher ratio can reflect faster sales or insufficient stock. Compare similar periods and check stockouts, seasonality and aged inventory.
The inventory turnover ratio formula
Inventory turnover = cost of goods sold (COGS) ÷ average inventory
A common starting estimate for the denominator is:
Average inventory = (beginning inventory + ending inventory) ÷ 2
Both balances should be measured on a consistent cost basis. CFI describes this cost-based turnover formula and notes that the calculation can cover a year, quarter, or month. CFI’s inventory turnover guide.
Using sales revenue instead of COGS produces a different metric. Revenue includes the markup over inventory cost, so it will generally create a higher ratio. Do not compare a sales-based figure with a cost-based benchmark as though they were equivalent.
For example, $1 million of revenue divided by $100,000 of average inventory gives 10. If COGS is $600,000, the cost-based turnover ratio is still 6. The difference comes from the numerator, not from inventory moving faster.
A complete annual calculation
Assume the following hypothetical figures for a 365-day year:
| Input | Amount |
|---|---|
| Beginning inventory at cost | $80,000 |
| Ending inventory at cost | $120,000 |
| Annual COGS | $600,000 |
First, calculate the two-point average:
($80,000 + $120,000) ÷ 2 = $100,000.
Then calculate turnover:
$600,000 ÷ $100,000 = 6 turns for the year.
To express the same relationship in days, use:
Inventory days = days in the period ÷ turnover for that period.
For this example, 365 ÷ 6 = 60.8 days, rounded to one decimal place. OpenStax presents this reciprocal relationship for the annual inventory conversion period. OpenStax on working capital and inventory days.
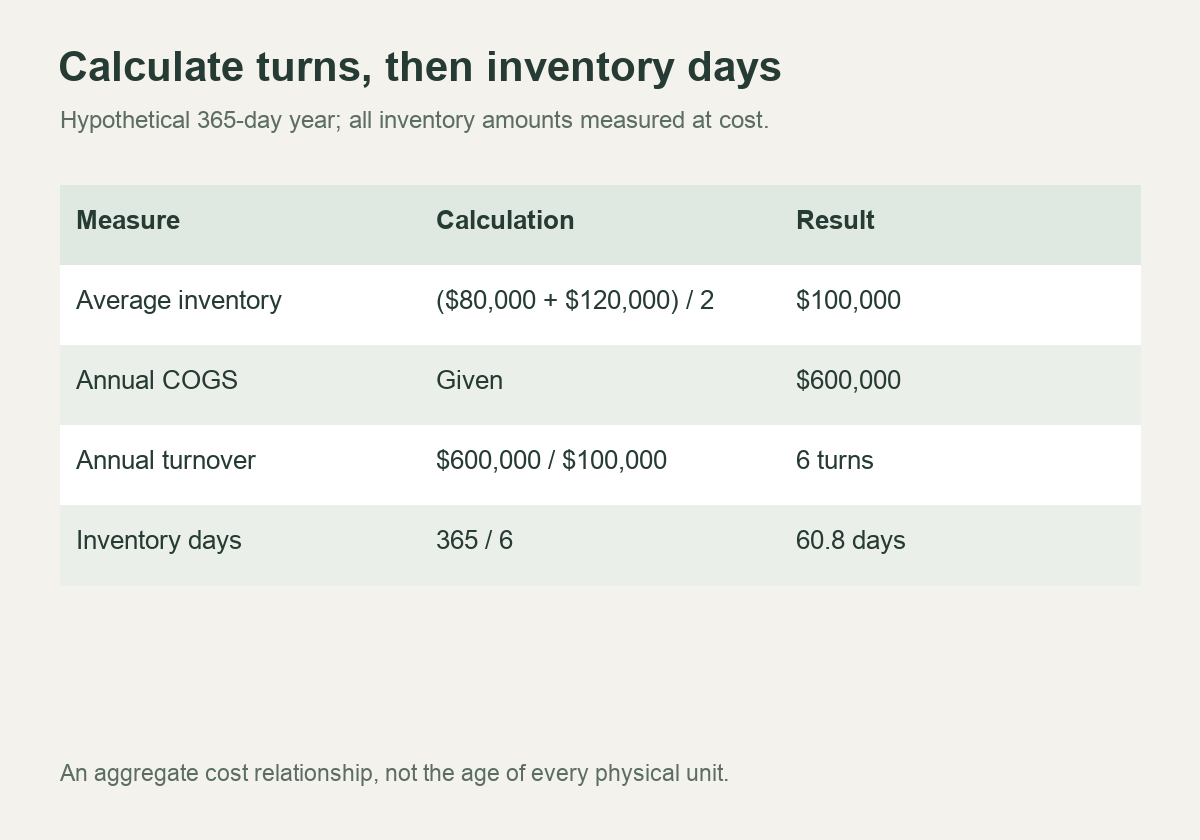
The 60.8-day result is an aggregate relationship between inventory cost and COGS. It does not mean that each physical unit spent exactly 61 days in the warehouse. Some units may have shipped immediately while others remained for months.
What changes for a monthly calculation?
Suppose a 30-day month has COGS of $60,000 and average inventory of $20,000. Turnover is 3 times for that month, and inventory days are 30 ÷ 3 = 10 days.
Dividing 365 by that monthly turnover would mix periods. Multiplying the monthly ratio by 12 would be an annualized estimate, not an observed annual result. Label it that way if you use it, and consider whether that month represents the rest of the year.
Choose an inventory average that represents the period
Beginning and ending balances are convenient, but two dates may miss what happened between them.
Imagine another business that begins and ends the year with $100,000 of inventory. Its two-point average is $100,000. It also held much more stock through a long seasonal buildup. Suppose reliable daily balances show a $160,000 average over the full year.
With $600,000 of annual COGS, the results differ:
| Averaging method | Average inventory | Annual turnover |
|---|---|---|
| Beginning and ending only | $100,000 | 6.00 |
| Average of daily balances | $160,000 | 3.75 |
Neither calculation changed sales. The second uses a more detailed view of inventory held during the period. This is an illustrative sensitivity example, not a finding about a real retailer.
If you have daily balances, sum the balances and divide by the number of days included. If you use regular month-end snapshots, average those snapshots and label the method. Avoid mixing different sampling methods across periods without explaining the change.
Choose a reporting convention with finance and keep it consistent. More observations help only if the underlying records are accurate; daily snapshots of incorrect inventory do not solve the problem.
Is a high inventory turnover ratio good?
A higher ratio can indicate that sales are supported with less average inventory. It can also occur when a business runs too lean and repeatedly misses demand. Shopify’s turnover guide discusses the tradeoff between slow inventory and shortages, and the importance of the retail context. Shopify’s inventory turnover guide.
Ask what changed alongside the ratio:
| Pattern | Possible explanation | Check next |
|---|---|---|
| Turnover rises; availability stays healthy | Inventory may be working more efficiently | Margin, forecast accuracy, and replenishment cost |
| Turnover rises; stockouts also rise | Average stock may be too low | Lost sales, backorders, and lead-time reliability |
| Turnover falls before a planned peak | Stock may have arrived ahead of demand | Seasonal plan and expected selling window |
| Turnover falls; old stock accumulates | Purchasing or assortment may exceed demand | SKU aging, sell-through, and open purchase orders |
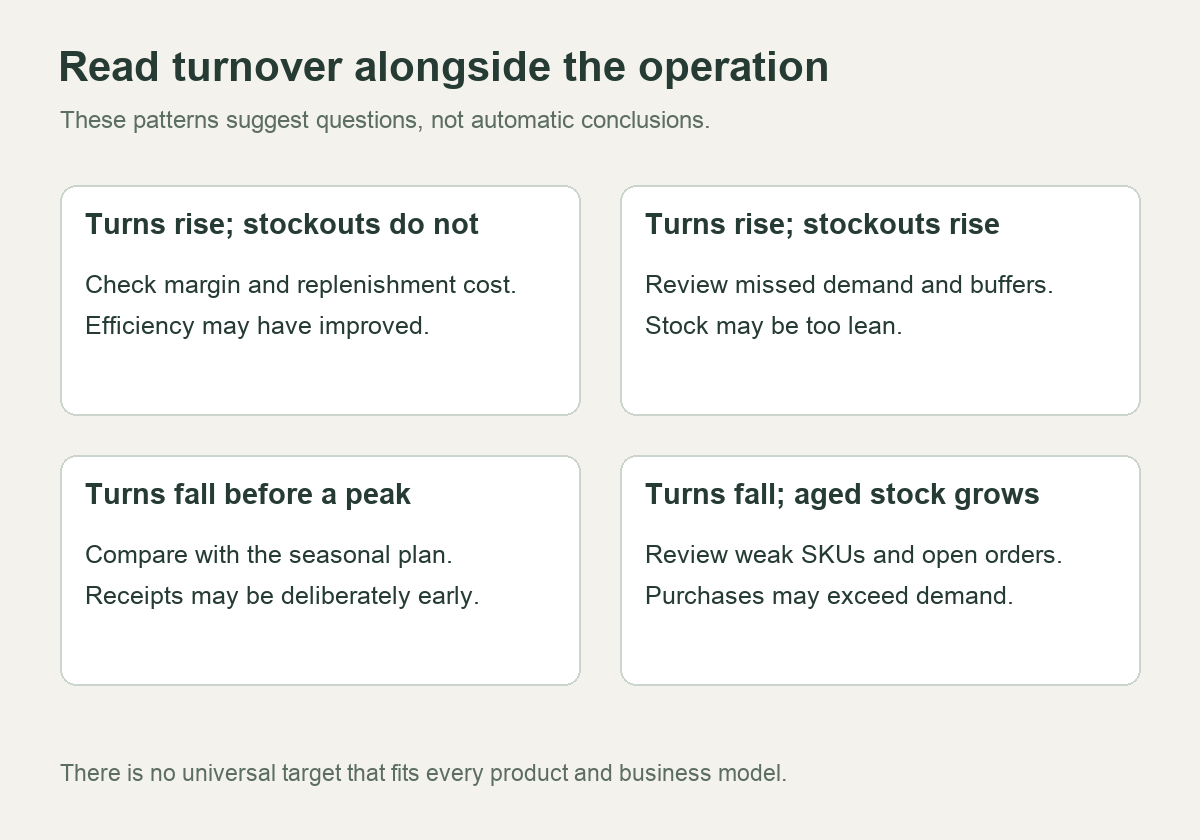
These are diagnostic possibilities, not conclusions from the ratio alone. A rising ratio after deep discounting may coincide with weaker margin. A lower ratio before a product launch may reflect a deliberate purchase rather than a forecasting failure.
There is no useful universal target such as “every ecommerce store should turn inventory six times.” Compare like products, similar business models, the same period, and compatible accounting methods. A replenishable consumable and a seasonal furniture range have different operating constraints.
Start with your own comparable history and purchasing plan. An outside benchmark is most useful when you can see its population, time period, and calculation method.
Turnover is not sell-through or stock age
Use related measures to answer the questions turnover leaves open.
| Measure | Question it helps answer | Main distinction |
|---|---|---|
| Inventory turnover | How much COGS did we generate relative to average stock cost? | Cost-based, for a defined period |
| Inventory days | What is the same relationship expressed in days? | Aggregate estimate, not a receipt-date report |
| Sell-through | How much of a defined stock cohort or available quantity sold? | Usually unit-based; denominator must be stated |
| Stock age | How long have particular units or batches been held? | Requires receipt or batch history |
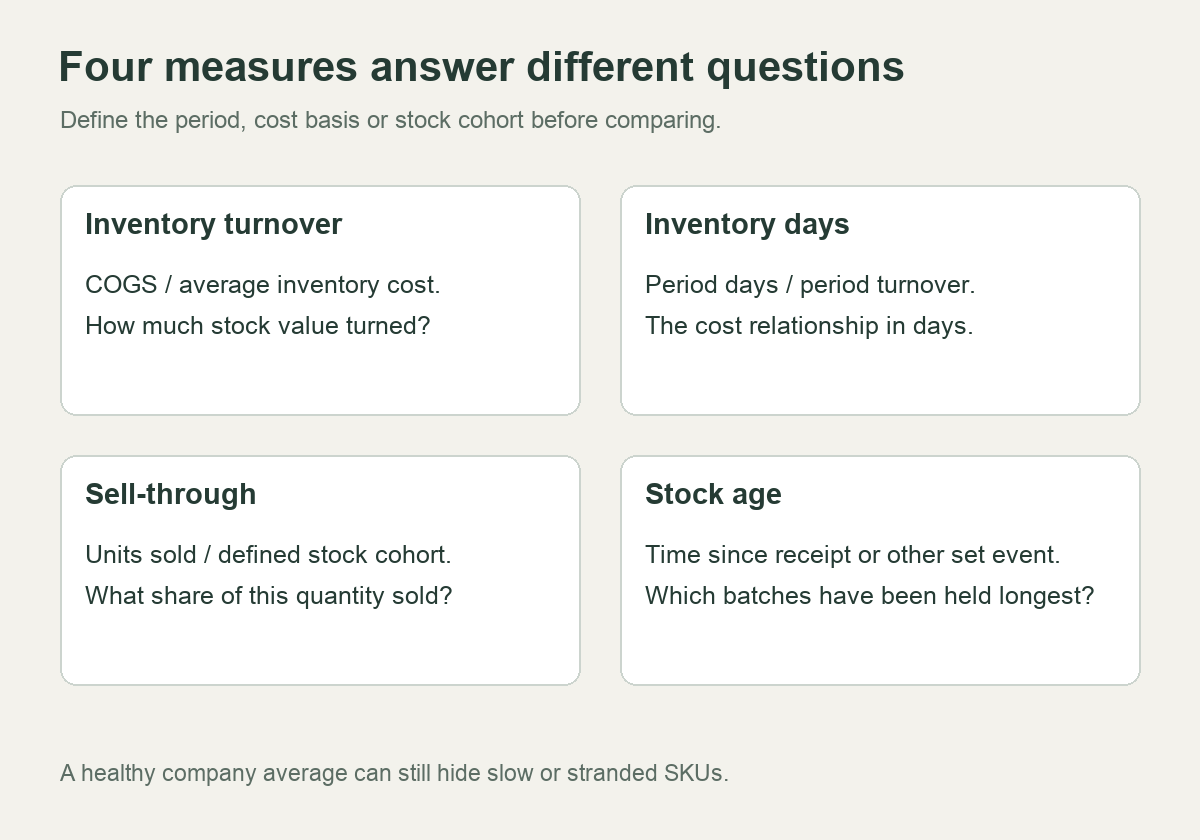
For a simple cohort example, receiving 200 units and selling 120 of that same cohort gives 60% sell-through, assuming no returns or adjustments. That does not establish the business’s inventory turnover ratio. The cohort definition and the cost-based average inventory answer different questions.
A business-wide ratio can also conceal weak products. Fast-moving lines may generate most of the COGS while a few expensive variants occupy the warehouse. Review categories and SKUs using matching sales-cost and inventory data. Do not calculate a category ratio with company-wide COGS.
Check valuation changes before celebrating an improvement
Inventory value can change without a sale. For example, under IFRS, IAS 2 addresses inventory write-downs to net realizable value and recognizes the write-down as an expense. This is an IFRS example, not a statement that the same treatment applies to every US business. IFRS Foundation’s IAS 2 overview.
A lower recorded inventory balance can increase the calculated ratio even though no customer bought the affected units. Depending on how expenses are classified, the numerator may change too. Ask finance to explain significant valuation changes, write-offs, and reclassifications before comparing periods.
For internal operational analysis, it may be useful to show a separately labeled view of sales activity and inventory adjustments. Reconcile it to the financial figures rather than silently replacing them. The accounting ratio and the operational explanation should remain traceable.
The same discipline applies to cost inputs. An operational landed cost worksheet for China sourcing can help compare purchase offers, but its planning cost categories are not automatically the inventory carrying values in your accounts. Use the accounting cost basis for the reported turnover ratio.
Use the result to make a purchasing decision
If slow stock is driving the result
Pull an aging report and identify the SKUs holding the largest inventory cost. Check pending purchase orders before changing the next reorder. Reducing a future order has little effect if a large earlier order is already in production.
Review why the stock is slow. It may be the wrong variant, a missed season, an inaccurate listing, a changed selling price, or demand that never developed. Those causes need different responses. Discounting every slow item uses margin without necessarily addressing the purchasing problem.
When supplier minimums are the constraint, compare the full economics of negotiating smaller orders with Chinese suppliers. A smaller order can reduce exposure while increasing unit cost or shipment frequency. Model those tradeoffs instead of optimizing turnover alone.
If shortages are driving a high ratio
Review demand missed during stockouts, replenishment timing, and buffer settings. Sales history can understate demand when customers could not buy the product. Cutting stock again to improve the ratio may make that distortion worse.
Look at the full path from purchase order to stock available for dispatch. Goods waiting for counting, inspection, or system release cannot necessarily satisfy an order just because they have arrived at a warehouse.
For goods held in China, a discussion about warehousing and fulfillment should include how receipts, unavailable stock, and releases are recorded. Confirm the reporting scope you need. Ask for the receipt and stock-status records needed to reconcile the warehouse figures with your inventory report.
A repeatable monthly review
Keep a short calculation record with each report:
- Reporting dates and the number of days in the period.
- COGS source, included products or locations, and currency.
- Inventory cost basis and averaging method.
- Turnover and the matching inventory-days calculation.
- Significant stockouts, seasonal receipts, and valuation adjustments.
- The purchasing or inventory action, owner, and next review date.
Pair the ratio with gross margin, availability, and aged-stock exposure. That gives a buyer enough context to decide whether to reorder, reduce a purchase, investigate a shortage, or stop replenishing a weak SKU.
Frequently asked questions
Can inventory turnover be less than one?
Yes. For a given period, it means COGS is lower than average inventory value. For example, $80,000 of annual COGS divided by $100,000 of average inventory is 0.8 turns. Investigate the reason rather than treating the result as a complete diagnosis.
Can I calculate it without COGS?
You need a defensible cost figure for the cost-based ratio. A revenue-based alternative must be labeled differently and should not be compared directly with COGS-based ratios. If the cost records are incomplete, resolve that gap before using the number for purchasing decisions.
What if average inventory is zero?
The ratio is undefined because its denominator is zero. Check the period, stock ownership model, and records. Do not display it as infinite operational efficiency. If COGS is zero but average inventory is positive, turnover is zero and the reciprocal inventory-days measure is not finite.